Data Visualization SEO: Charts & Rankings
Optimize charts, graphs, and infographics for SEO visibility. Learn image optimization, alt text strategies, and structured data for visual content rankings.
The digital landscape is awash with information, statistics, and reports, making it increasingly difficult for businesses to convey clear, impactful messages. This challenge is precisely where data visualization proves invaluable, transforming complex datasets into accessible, memorable, and engaging visual formats—from charts and graphs to infographics and interactive dashboards.
However, even the most stunning visualization achieves little if it cannot be discovered by the intended audience. This critical need brings us to the powerful intersection of data visualization and Search Engine Optimization (SEO). While many perceive SEO as solely focused on text, keywords, and links, modern search engines like Google have evolved considerably. They now actively interpret images, understand visual context, and prioritize a holistic user experience, making the optimization of visual content more crucial than ever.
What is Data Visualization SEO?
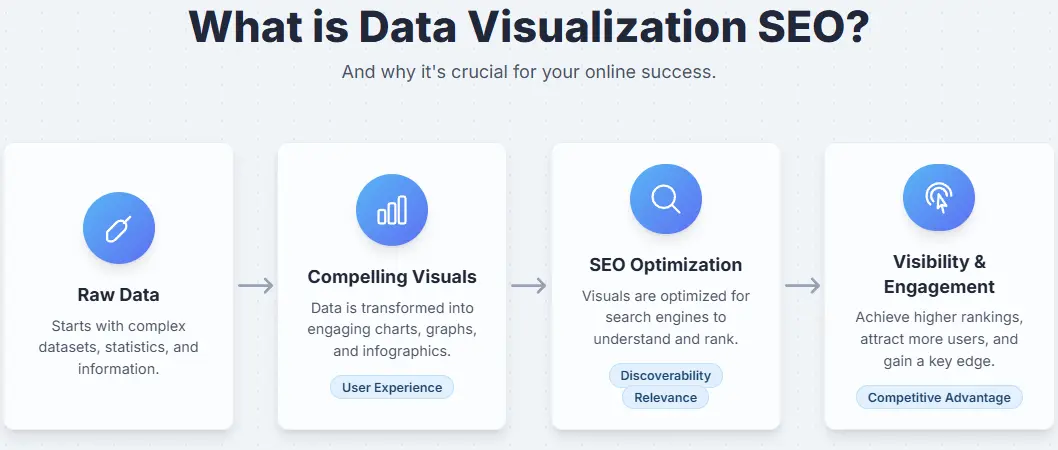
Simply put, Data Visualization SEO is the strategic process of optimizing your visual data assets so that they can be easily discovered, understood, and ranked by search engines. It's about ensuring that your insightful charts, compelling graphs, and informative infographics don't just look good, but also perform well in search results, driving organic traffic to your website.
Think of it this way: just as you optimize your written content with relevant keywords, headings, and internal links, you also need to optimize your visual content. This involves a range of techniques, from technical considerations like file formats and alt text to strategic elements like schema markup and user engagement. It’s about helping search engines "see" and "understand" your visuals in the same way a human would, allowing them to serve your content to the right audience at the right time.
Why is Data Visualization SEO Crucial in Today's Digital Landscape?
The shift towards visual content consumption is undeniable. People are more likely to engage with and remember information presented visually. From social media feeds dominated by images and videos to "visual search" becoming a prominent feature on platforms, our brains are wired to process visuals much faster than text.
Here's why prioritizing Data Visualization SEO isn't just a good idea, but a necessity:
- Improved User Engagement and Experience: High-quality, well-optimized visualizations captivate audiences. They reduce bounce rates, increase time on page, and make your content more shareable, all of which signal positive user experience to search engines.
- Enhanced Search Engine Understanding: Search engines are getting smarter. By providing proper context and metadata for your visuals, you help them categorize and index your content more effectively, leading to better relevance in search results.
- Increased Visibility and Traffic: Optimized visuals can appear in image search results, rich snippets, and even directly in regular web search results. This opens up new avenues for organic traffic that might otherwise be missed.
- Competitive Advantage: While many focus solely on text-based SEO, optimizing visuals is still an untapped frontier for many businesses. Mastering this can give you a significant edge over competitors.
- Addressing Visual Search Trends: As voice search and visual search technologies advance, having your visual content optimized becomes even more critical for future discoverability.
In essence, Data Visualization SEO is about bridging the gap between compelling visual storytelling and the technical requirements of search engine algorithms. It’s about ensuring that your efforts in creating insightful visuals translate into tangible business outcomes: improved visibility, increased traffic, and more leads.
The "What" and "Why": Delving Deeper into Data Visualization SEO
To truly grasp Data Visualization SEO, let's break down its core components and reiterate why it’s not just a trend but a fundamental aspect of modern digital marketing.
What is Data Visualization SEO, Really?
At its heart, Data Visualization SEO is about making your visual content searchable. It's the art and science of ensuring that when someone types a query into a search engine that could be answered or enhanced by your visualization, your visual asset appears prominently. This isn't just about images; it includes all forms of visual data presentation.
Consider these key elements that define Data Visualization SEO:
- Discoverability: Can search engines find and index your visual content? This involves technical aspects like crawlability and proper site structure.
- Relevance: Does your visual content truly answer or illustrate the user's query? This is where good alt text, descriptive captions, and surrounding context come into play.
- Contextual Understanding: How well does the search engine understand what your visualization is about and how it relates to the surrounding text? Schema markup and clear content hierarchies are vital here.
- User Experience: Is your visualization easy to view, fast to load, and accessible to everyone, including those with disabilities? Performance and accessibility are paramount.
Table 1: Key Components of Data Visualization SEO
| Component | Description | Why it Matters for Visuals |
|---|---|---|
| Technical SEO | Site speed, mobile-friendliness, crawlability, proper sitemaps. | Ensures visuals load fast and are found by search engines, especially on mobile devices. |
| On-Page SEO | Alt text, captions, surrounding text, headings, descriptive file names. | Provides context and keywords for search engines to understand the visual's content. |
| Schema Markup | Structured data that provides explicit information about the content (e.g., ImageObject, VideoObject). | Helps search engines interpret the visual's meaning and display rich results. |
| User Experience (UX) | Visual clarity, interactivity, mobile responsiveness, load times. | Engages users, reduces bounce rates, and signals positive user experience to search engines. |
| Off-Page SEO | Backlinks, social shares, mentions. | Boosts authority and visibility when quality visuals are linked to and shared. |
Why is Data Visualization SEO Crucial for Your Business?
Beyond the technicalities, the "why" boils down to tangible business outcomes.
- Improve Business Visibility: In an increasingly competitive online world, standing out is hard. High-ranking, optimized data visualizations act as powerful magnets, drawing new eyes to your brand. They don't just appear in regular web searches; they also show up in image searches, offering another valuable pathway to your site. Imagine your infographic appearing prominently when someone searches for statistics related to your industry – that's direct visibility.
- Increase in Traffic and Business Leads: More visibility naturally leads to more organic traffic. When users click on your optimized visuals in search results, they land on your page, consuming your content and potentially exploring your services. This direct engagement significantly increases the chances of converting visitors into leads. A well-placed, informative chart can answer a user's query instantly, establishing your authority and encouraging them to delve deeper.
- Time and Cost Savings: Manual SEO optimization can be incredibly time-consuming, especially for businesses with a large volume of visual content. This is where AI-powered platforms come into play. By automating the auditing process, identifying issues, and even suggesting solutions, these platforms can drastically reduce the manual effort required. Instead of spending hours on individual image alt tags or schema generation, an AI system can analyze your entire website, highlight critical areas for improvement, and even help you generate SEO-optimized content. This automation translates directly into significant time and cost savings, allowing your team to focus on strategy and content creation rather than repetitive tasks.
In summary, Data Visualization SEO is not an afterthought; it's a proactive strategy to ensure your valuable visual assets are seen by the right audience at the right time, contributing directly to your business's growth and efficiency.
How to Optimize Data Visualizations for SEO: A Practical Guide
Now that we understand the "what" and "why," let's dive into the "how." Optimizing your data visualizations for SEO involves a blend of technical precision, creative content strategy, and user-centric design. Here’s a comprehensive look at the practical steps you can take.
1. Image Optimization Basics: The Foundation
Before diving into complex strategies, ensure your images are technically sound.
- File Formats: Choose the right format for the job.
- JPEG: Ideal for photographs and complex images with many colors due to its high compression and small file size.
- PNG: Best for graphics, logos, and images requiring transparency or sharp lines, though file sizes can be larger.
- SVG (Scalable Vector Graphics): Excellent for line art, logos, and simple illustrations. They are resolution-independent, meaning they look sharp on any screen size, and their file sizes are often very small. They are also text-based, making them inherently more readable by search engines.
- WebP: A modern format offering superior lossless and lossy compression for images on the web, often resulting in smaller file sizes than JPEG or PNG while maintaining quality. It's gaining widespread browser support.
- File Size and Compression: This is critical for page load speed. Large image files can significantly slow down your website, leading to higher bounce rates and negative SEO signals.
- Compress your images using tools like TinyPNG, ImageOptim, or online compressors before uploading them.
- Aim for the smallest possible file size without sacrificing noticeable quality.
- Descriptive File Names: Don't upload
IMG_12345.jpg. Instead, use descriptive, keyword-rich file names separated by hyphens.- Bad:
chart.png - Good:
2024-marketing-budget-allocation-chart.png
- Bad:
2. Alt Text and Titles: Describing Your Visuals to Machines (and Humans!)
This is perhaps one of the most crucial elements for image SEO.
- Alt Text (Alternative Text): This HTML attribute describes an image. Its primary purpose is for accessibility, allowing screen readers to describe images to visually impaired users. From an SEO perspective, it provides search engines with context about the image content.
- How to write effective Alt Text:
- Be descriptive and specific.
- Include relevant keywords naturally, but avoid keyword stuffing.
- Keep it concise (aim for under 125 characters, though not a strict rule).
- Describe what's in the image and its purpose.
- Example (for a bar chart showing website traffic sources):
Alt text: Bar chart showing website traffic sources in 2026, with organic search as the largest contributor.
- How to write effective Alt Text:
- Image Titles: While less impactful for SEO than alt text, the
titleattribute provides additional information that appears when a user hovers over an image. It can enhance user experience.- Example:
Title: Key traffic sources for a business website in 2026.
- Example:
3. Contextual Relevance: The Power of Surrounding Content
Search engines don't just look at the image; they analyze the entire page.
- Placement: Embed your data visualizations within relevant text. Don't just dump them on a page. The surrounding paragraphs should explain what the visual represents, interpret its findings, and elaborate on its significance.
- Surrounding Text and Headings: Use clear headings (H1, H2, H3, etc.) that introduce the section containing the visualization. Ensure the text around the image uses relevant keywords that reinforce the image's topic. This helps search engines understand the overall theme and context.
- Captions: While similar to alt text, captions are visible to users. Use them to provide a brief, engaging explanation of the visual directly beneath it. This improves user experience and provides more keyword opportunities.
4. Schema Markup for Visuals: Speaking the Search Engine's Language
Schema markup (structured data) is a powerful way to provide explicit information to search engines about the content on your page. For data visualizations, this can be incredibly beneficial.
- ImageObject and VideoObject Schema: You can use
ImageObjectorVideoObjectschema to provide more detailed metadata about your images or embedded videos. This includes properties likecontentUrl,description,name,thumbnailUrl, and evenauthororlicense. - Graph/Chart Schema (emerging): While not a universally adopted standard like
ImageObjectyet, there are ongoing discussions and experiments around schema specifically for charts and graphs to describe the data points within them. Keeping an eye on these developments is crucial. - How it helps: Implementing schema markup can qualify your content for rich results in search, such as larger image previews or carousels, which dramatically increase visibility and click-through rates.
- Manually generating and implementing schema markup can be complex and prone to errors. This is where an AI SEO platform can simplify the process significantly. It can help you detect existing schema issues, validate your structured data, and even suggest or generate appropriate schema markup for your visual content, ensuring your visualizations are speaking the search engine's language perfectly. This automation reduces technical burden and helps you unlock rich snippet opportunities without requiring deep coding knowledge.
Turn invisible SEO data into clear visuals with our Free Chrome extension.
5. User Experience (UX) Considerations: Beyond the Algorithm
Google increasingly prioritizes user experience. If your visuals aren't user-friendly, it will negatively impact your SEO.
- Mobile Responsiveness: Your data visualizations must render perfectly on all devices – desktops, tablets, and smartphones. If they don't scale properly, are unreadable, or cause horizontal scrolling on mobile, users will leave, and Google will penalize your rankings.
- Load Speed: As mentioned with file size, speed is paramount. Use modern image formats, compress files, and leverage browser caching and Content Delivery Networks (CDNs) for faster delivery.
- Interactivity (if applicable): If your visualization is interactive (e.g., a clickable dashboard), ensure the interactive elements are accessible and don't rely on technologies that search engines can't easily crawl (e.g., heavy JavaScript without proper server-side rendering or pre-rendering). Make sure the core data is still accessible.
6. Backlinks and Sharing: Amplifying Your Visuals
High-quality, insightful data visualizations are inherently shareable and linkable.
- Create Shareable Content: Design your visuals to be compelling, informative, and easy to understand. Visuals that explain complex topics simply are often shared widely.
- Promote Your Visuals: Share them on social media, in newsletters, and within relevant communities.
- Earn Backlinks: When other websites find your visualizations valuable and link to them, it signals authority and relevance to search engines, significantly boosting your SEO. An engaging infographic, for instance, can become a valuable asset for earning high-quality backlinks.
By meticulously applying these optimization techniques, you transform your data visualizations from static images into powerful SEO assets, driving more relevant traffic and improving your overall online presence.
The Benefits of Effective Data Visualization SEO: Real Outcomes for Your Business
Beyond the technicalities of optimization, the true value of Data Visualization SEO lies in the tangible benefits it brings to your business. When executed effectively, it’s not just about better rankings; it’s about better business.
1. Increased Organic Traffic from Diverse Sources
Optimized data visualizations unlock new pathways for users to discover your content.
- Image Search Traffic: Your visuals can rank prominently in Google Images, Bing Images, and other visual search engines. This opens up a significant, often untapped, source of traffic.
- Rich Snippets and Featured Visuals: With proper schema markup, your visualizations can appear as rich snippets or even be featured in Google's Knowledge Graph or "People Also Ask" sections, drawing more attention and clicks.
- Enhanced Web Search Visibility: A well-optimized image embedded in a high-quality article can improve the entire page's ranking for relevant keywords, leading to more organic traffic from standard web searches.
Table 2: Traffic Source Diversification through Visual SEO
| Traffic Source | How Data Visualization SEO Contributes |
|---|---|
| Organic Search | Improved page rankings due to comprehensive content and user engagement from visuals. |
| Image Search | Direct traffic from users searching specifically for visual content. |
| Referral Traffic | From websites linking to your insightful visualizations. |
| Social Media | Increased shares and clicks when visuals are engaging and easy to understand. |
| Direct Traffic | Users returning to your site because they remember your impactful visual content. |
2. Higher Rankings for Visual Content and Associated Pages
Search engines reward content that provides value and an excellent user experience. Optimized data visualizations do both.
- Signals of Quality: High-quality, well-optimized visuals increase time on page, reduce bounce rates, and encourage social sharing – all positive signals to search engines that your content is valuable and authoritative.
- Keyword Association: By linking relevant keywords to your visuals through alt text, captions, and surrounding text, you strengthen your page's relevance for those keywords, leading to higher rankings.
- Topical Authority: Consistently publishing and optimizing high-quality data visualizations on specific topics can help establish your website as an authority in your niche, benefiting all your content.
3. Improved Brand Authority and Credibility
Visual content, especially data visualizations, can build trust and establish you as an expert.
- Thought Leadership: Presenting complex data in an understandable visual format positions your brand as knowledgeable and insightful.
- Professionalism: High-quality, polished visualizations reflect positively on your brand's professionalism and attention to detail.
- Memorability: People remember visuals far more than blocks of text. A memorable chart or infographic can cement your brand in the minds of your audience.
4. Better User Engagement and Time on Page
Engaged users are happy users, and happy users send positive signals to search engines.
- Instant Comprehension: Visuals break down complex information into digestible chunks, making content easier and faster to understand. This keeps users on your page longer.
- Increased Dwell Time: When users spend more time interacting with your charts, graphs, or infographics, it indicates high engagement, which is a strong positive ranking factor.
- Reduced Bounce Rate: If users find what they're looking for quickly and easily through your visuals, they are less likely to leave your site immediately.
5. Enhanced Conversion Rates and Business Leads
Ultimately, SEO is about driving business growth. Data Visualization SEO contributes directly to your bottom line.
- Clearer Calls to Action: Visuals can highlight key data points that lead directly to a call to action, making it more impactful.
- Problem-Solving Visuals: If your data visualization helps users understand a problem and your content offers a solution, it naturally guides them towards becoming a lead.
- Build Trust, Drive Action: When users trust your insights presented visually, they are more likely to trust your brand and take the next step, whether it's signing up for a newsletter, downloading a resource, or making a purchase.
6. Cost and Time Savings (Automated Efficiency)
While not a direct SEO benefit, the efficiency gained through intelligent tools frees up resources for even more optimization efforts.
- As highlighted earlier, platforms like Digispot AI streamline the auditing, issue detection, and even schema generation processes. This automation reduces the manual labor and expertise required, leading to substantial savings in both time and operational costs. For businesses operating at scale, this efficiency is paramount, allowing them to optimize a vast amount of visual content without extensive human intervention.
By focusing on these outcomes, businesses can see that investing in Data Visualization SEO is not just an SEO tactic, but a strategic move that significantly contributes to their overall digital success and business growth.
The Role of AI in Data Visualization SEO: Smart Solutions for Modern Challenges
The sheer volume of data and digital content today makes manual SEO optimization for every visual asset a daunting, if not impossible, task. This is where Artificial Intelligence (AI) emerges as a game-changer, revolutionizing how businesses approach Data Visualization SEO. AI isn't just about automation; it's about intelligent analysis, prediction, and optimization at scale.
How AI Transforms Data Visualization SEO:
AI-powered platforms and tools can go beyond simple checks, offering deep insights and automated solutions that human analysts would take days or weeks to uncover.
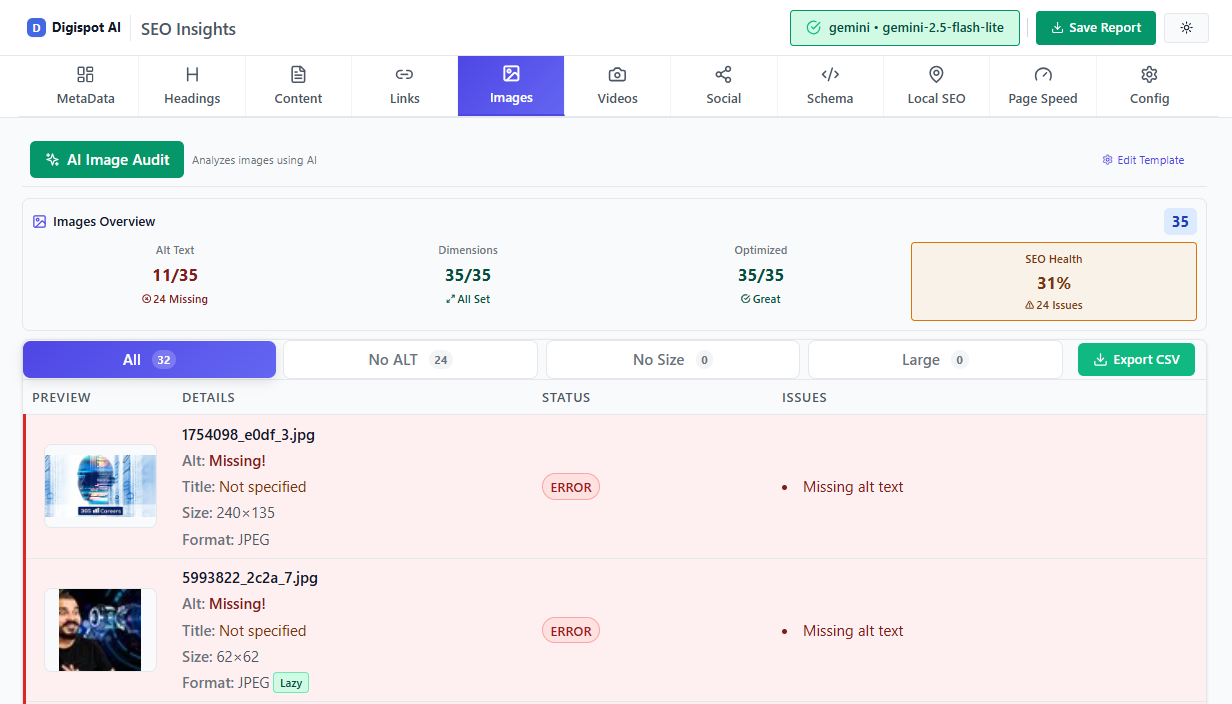
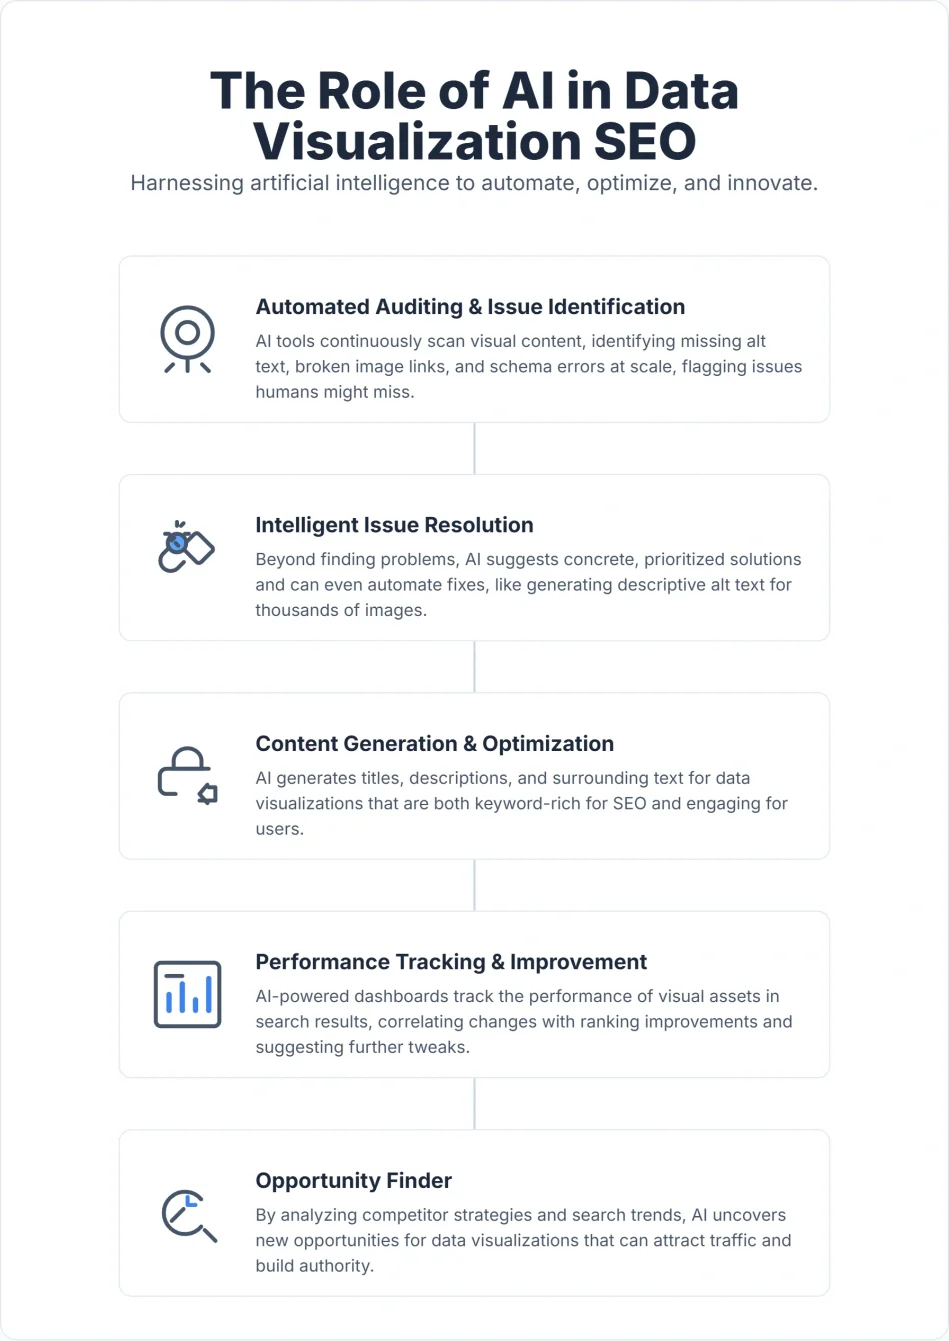
- Automated Auditing and Issue Identification:
- AI can crawl entire websites, analyzing every image, chart, and infographic for SEO compliance. This includes checking for missing alt text, incorrect file formats, oversized images, non-mobile-responsive visuals, and more.
- It can audit websites in both mobile and desktop modes, identifying specific issues that affect performance on different devices. This dual-mode analysis is crucial in a mobile-first indexing world.
- Furthermore, AI tools can go beyond simple errors, detecting subtle issues related to content context, keyword relevance, and potential duplicate visual content that might dilute SEO value.
- Intelligent Issue Resolution and Recommendations:
- Once issues are identified, AI can help to solve them by providing actionable, prioritized recommendations. This isn't just a list of problems; it's a roadmap to improvement.
- For example, an AI could suggest optimal alt text based on image content and surrounding text, recommend more efficient file formats, or point out where schema markup is missing.
- Content Generation and Optimization:
- AI agents, particularly those powered by large language models (LLMs), can assist in generating SEO-optimized captions, image descriptions, and even surrounding textual content that enhances the context of your data visualizations. This content studio capability ensures your visuals are well-supported by highly relevant and keyword-rich text.
- Performance Tracking and Improvement:
- Advanced AI SEO platforms seamlessly integrate with Google Search Console and Google Analytics. This integration allows them to track the performance of your optimized visuals in real-time, showing how they contribute to traffic, rankings, and user engagement.
- This data-driven feedback loop is essential for continuous improvement, allowing the AI to refine its recommendations based on actual performance.
- Opportunity Finder:
- AI can analyze search trends, competitor strategies, and your existing content gaps to spot opportunities for new data visualizations that are likely to rank well. This proactive approach helps you create content that fills a specific need and has a high chance of success.
- Comprehensive Ranking Factor Analysis:
- An AI platform designed for SEO, such as Digispot AI, understands and helps you rank better by analyzing your site for 200+ ranking factors. This includes a deep dive into:
- Content SEO: How relevant, unique, and valuable your visual content and its surrounding text are.
- Technical SEO: Site speed, crawlability, indexing, and mobile responsiveness specifically for visuals.
- Local SEO: If your visuals relate to local businesses, ensuring they are optimized for local search.
- Page Performance: Load times, interactivity, and overall user experience for pages containing data visualizations.
- An AI platform designed for SEO, such as Digispot AI, understands and helps you rank better by analyzing your site for 200+ ranking factors. This includes a deep dive into:
The Digispot AI cloud platform encapsulates these AI capabilities, bringing together SEO best practices into an automated and user-friendly model designed for operating at scale with accuracy. It streamlines the complex process of optimizing visual content, making it accessible even for those without deep SEO expertise.
Digispot AI's Free Community Chrome Extension: Your On-the-Go Auditor
For immediate, page-level insights, Digispot AI also offers a free community Chrome extension. This powerful browser tool is like having an SEO expert in your pocket, specifically designed to help you audit your website page in your browser.
- Instant Page Audit: With a single click, the extension can analyze the current page you're viewing for various SEO factors, including how your data visualizations are performing.
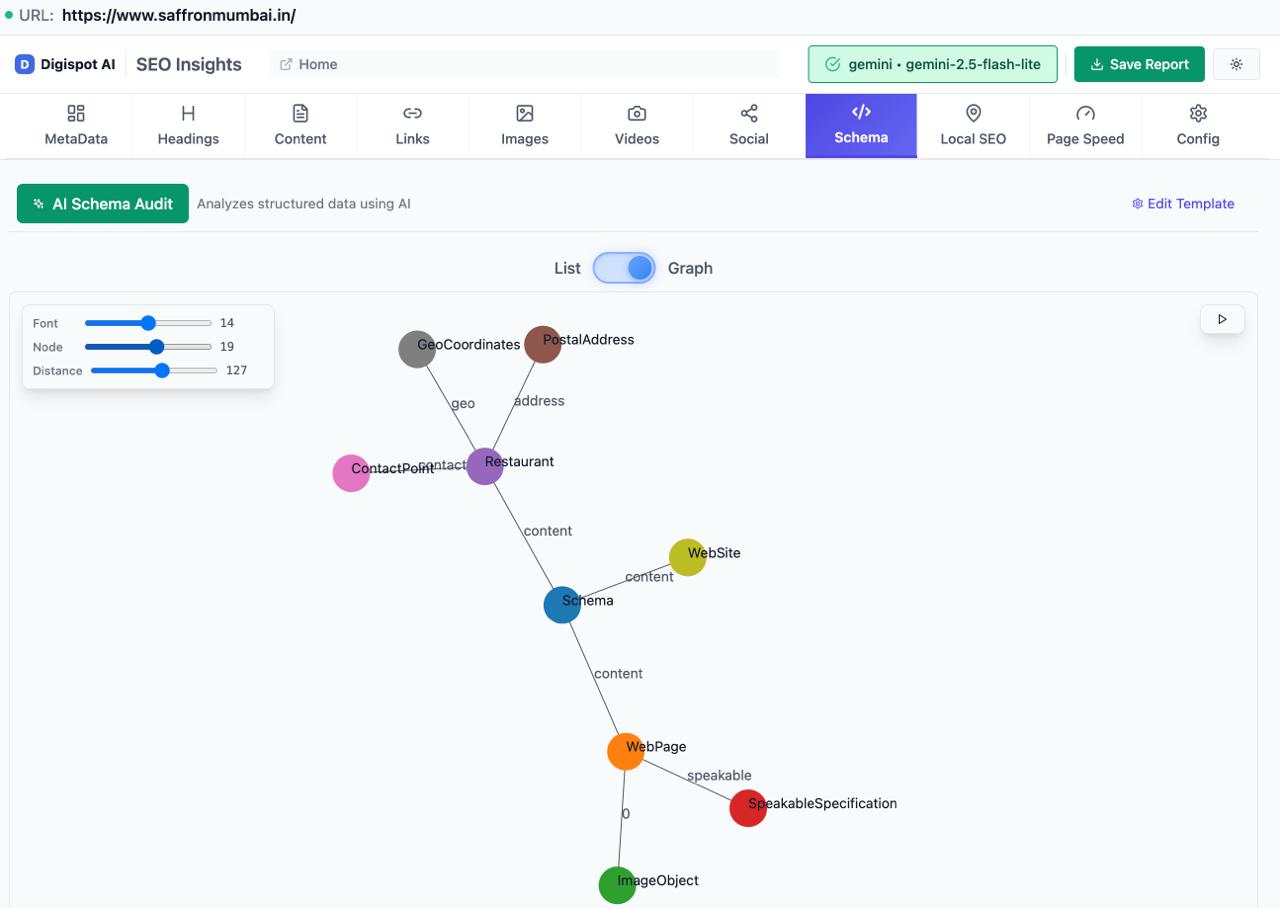
- Schema Markup Detection and Visualization: One of its standout features is its ability to detect and visualize schema markup. This means you can instantly see if your images or charts have proper structured data applied and identify any errors. For example, if you have a bar chart representing sales data, the extension could highlight if it's missing
ImageObjectschema or if thedescriptionproperty is empty. - Issue Detection: It quickly identifies issues like missing alt text, poor image compression, non-responsive visuals, or broken image links, presenting them in an easy-to-understand format.
- LLM-Powered Insights: Powered by popular LLM models, the extension can even provide context-aware suggestions for improvements. For instance, it might suggest more descriptive alt text for a specific chart based on the surrounding content, or recommend how to improve the visual hierarchy. Imagine browsing a page with a complex infographic; the extension could not only tell you if its alt text is missing but also suggest what good alt text might be, based on analyzing the visible text around the infographic.
- Visualization of SEO Elements: It can visualize how search engines "see" your page, highlighting indexed elements, crawlable links, and even rendering potential rich snippets for your visual content. This visual feedback is invaluable for understanding and rectifying issues.
This extension empowers marketers, content creators, and business owners to conduct quick, effective audits of their visual content directly from their browser, ensuring that their data visualizations are always working their hardest for SEO. It's a testament to how AI can democratize complex SEO tasks, making advanced tools accessible to a wider audience for immediate impact.
By leveraging the power of AI, businesses can move from reactive SEO fixes to proactive, strategic optimization for their data visualizations, ensuring they achieve maximum visibility and impact in the visual search era.
Driving Business Outcomes with Data Visualization SEO and AI: Tangible Results
The ultimate goal of any SEO strategy, including Data Visualization SEO, is to achieve measurable business outcomes. When you effectively optimize your visual content, especially with the intelligent support of AI platforms, the impact on your bottom line can be significant and transformative.
Let's revisit the core business outcomes and understand how our comprehensive approach to Data Visualization SEO, supercharged by AI, helps achieve them:
1. Improving Business Visibility: Getting Seen Where It Matters
In a crowded digital marketplace, visibility is the first step toward success.
- Broadened Search Footprint: By optimizing visuals, your content doesn't just rank for text queries; it also appears in image search, video search, and increasingly in rich snippets and featured placements. This significantly expands your digital footprint.
- Dominating Niche Visuals: If you create unique, high-quality data visualizations relevant to your niche, you can become the go-to source. Imagine if a search for "global climate change trends chart" consistently brings up your detailed, optimized charts.
- AI for Gap Analysis: AI platforms like Digispot AI help you identify content gaps where a data visualization would thrive. By spotting what your competitors are missing or what users are searching for visually, AI guides your content creation efforts toward maximum visibility.
2. Increase in Traffic and Business Leads: Turning Views into Value
Visibility is great, but traffic and leads are what fuel business growth.
- Higher Click-Through Rates (CTR): Visuals are naturally more engaging. An optimized visual in search results (e.g., a rich snippet of a chart) is far more likely to get clicked than a plain text link.
- Qualified Traffic: Users searching for specific data points or visual explanations are often further along in their research or decision-making process. By serving them precisely what they need through an optimized visualization, you attract highly qualified traffic.
- Enhanced Conversion Pathways: Once on your site, compelling visualizations can simplify complex product features, demonstrate market trends relevant to your service, or highlight the impact of your solutions. This clarity helps guide users through the sales funnel. For instance, a business could present a chart showing their clients' SEO performance improvements using an AI platform; if this chart is well-optimized, it could attract potential leads directly interested in such outcomes.
3. Time and Cost Savings: Operational Efficiency at Scale
Perhaps one of the most underrated benefits, efficiency gained through AI, directly impacts your budget and resources.
- Automated Audit & Fixes: As discussed, AI significantly cuts down the manual labor involved in auditing, identifying, and even suggesting fixes for hundreds or thousands of images across your site. This is invaluable for large websites or businesses managing extensive content libraries.
- Streamlined Content Creation Workflow: AI-powered content studios can assist in generating SEO-friendly descriptions, reducing the time content teams spend on optimizing individual assets.
- Resource Allocation: By automating repetitive and technical SEO tasks related to visuals, your team can reallocate valuable time and resources to strategic planning, creating even more compelling content, or focusing on other high-impact marketing activities. This leads to a more efficient and productive operation overall.
Table 3: How AI Accelerates Business Outcomes in Data Visualization SEO
| Business Outcome | How AI (e.g., Digispot AI) Contributes |
|---|---|
| Improving Visibility | Automated audits (desktop & mobile), schema detection, opportunity finder for new visual content, analysis of 200+ ranking factors. |
| Increase in Traffic/Leads | AI-driven content optimization (alt text, captions), rich snippet generation, performance tracking via GSC/GA integration. |
| Time & Cost Savings | Automated issue identification & resolution, AI-assisted content generation, efficient management of large visual assets. |
Real-World Application (Illustrative Example):
Imagine a B2B SaaS company that relies heavily on data reports and whitepapers to generate leads. They produce numerous charts and graphs illustrating market trends, product impact, and customer success. Manually optimizing each of these for alt text, file size, and schema would be a monumental task.
By using an AI SEO platform:
- The platform quickly audits all their existing visual content, identifying thousands of images with missing alt text or oversized files.
- It automatically suggests optimized file formats and provides precise recommendations for alt text based on the surrounding content.
- It detects which charts would benefit from
ImageObjectschema and even generates the necessary code snippets. - Through its integration with Google Search Console, it shows them which of their optimized charts are starting to appear in image search results, driving new, qualified traffic to their reports.
- The content studio feature helps them quickly generate compelling social media captions for their infographics, further extending their reach.
The result? A significant increase in organic traffic to their whitepapers, a higher number of downloads, and ultimately, a surge in qualified business leads, all achieved with a fraction of the manual effort.
In conclusion, Data Visualization SEO is not merely a technical exercise; it's a strategic imperative for any business looking to thrive in a visually driven digital world. When combined with the power of Artificial Intelligence, it transforms into an incredibly potent force, ensuring your valuable visual insights are not only seen but also drive measurable and impactful business growth. By adopting smart, automated solutions, businesses can unlock their full potential, achieving greater visibility, more traffic, increased leads, and significant operational efficiencies.
References
- Image best practices | Google Search Central
- Crawl Budget Management For Large Sites | Google Search Central
- Google Search Console
- Robots.txt Introduction and Guide | Google Search Central
- Improve your page speed and crawl efficiency | Google Search Central
- Get started with schema.org structured data | Google Search Central
- ImageObject | Schema.org
- Core Web Vitals | Google Search Central
- Mobile-first indexing (MFI) | Google Search Central
- Google Analytics
- Digispot AI - FREE On Page SEO Audit Tool
- Digispot AI - FREE Chrome Extension for SEO Insights
- How to reduce Google's crawl rate (for emergencies) | Google Search Central
Audit any page in seconds
200+ SEO checks including Core Web Vitals, schema markup, meta tags, and AI readiness — trusted by 1000+ SEO experts and marketers.
Frequently Asked Questions
Here are some of our most commonly asked questions. If you need more help, feel free to reach out to us.

Written by
Maya Krishnan
Digital growth expert
Maya is a seasoned expert in web development, SEO, and digital strategy, dedicated to helping businesses achieve sustainable growth online. With a blend of technical expertise and strategic insight, she specializes in creating optimized web solutions, enhancing user experiences, and driving data-driven results. A trusted voice in the industry, Maya simplifies complex digital concepts through her writing, empowering readers with actionable strategies to thrive in the ever-evolving digital landscape.