Log File SEO Analysis: Googlebot Insights
Analyze log files for SEO insights. Understand Googlebot crawling behavior and fix technical issues for better rankings.
Technical SEO often feels like a guessing game. You publish content, update meta tags, and build links, hoping Google notices your efforts. But are you relying on assumptions rather than hard data?
Most marketers obsess over keyword rankings and front-end content. The true masters of search optimization, however, look behind the curtain. They understand exactly how search engines interact with their infrastructure. The most accurate, unvarnished source of this information is log file analysis.
Log file analysis is the process of examining the raw data from your web server to track exactly when and how search engine crawlers, like Googlebot, visit your website. It is the only way to see your site exactly as a search engine sees it—without the filtering or delays inherent in tools like Google Search Console.
This guide explores the mechanics of log file analysis. You will learn what log files are, why they are the ultimate source of truth for technical SEO, and how to turn raw server data into actionable insights. From optimizing crawl budget to spotting critical errors before they impact rankings, this is your blueprint for mastering the technical side of search.
Chapter 1: What are Log Files?
To master log file analysis, you must first understand the data source. A server log file is an automatic, chronological record of every single request processed by your web server.
Every time a human user visits a page, a script loads an image, or a bot crawls a URL, the server records the event. This file captures the "handshake" between the client (browser or bot) and your server. Unlike analytics tools like GA4 which rely on JavaScript triggers—and can be blocked by ad blockers or fail to load—server logs record everything. They are 100% accurate because they are generated by the machine serving the content.
1.1. The Anatomy of a Log File
Raw log data can look intimidating. However, once you understand the structure, it becomes a goldmine of SEO intelligence. Most servers use the Common Log Format or Combined Log Format.
Here is a standard example of a log entry you might see during an audit:
66.249.66.1 - - [19/Jul/2025:14:22:01 +0000] "GET /blog/technical-seo-guide/ HTTP/1.1" 200 15678 "-" "Mozilla/5.0 (compatible; Googlebot/2.1; +http://www.google.com/bot.html)"
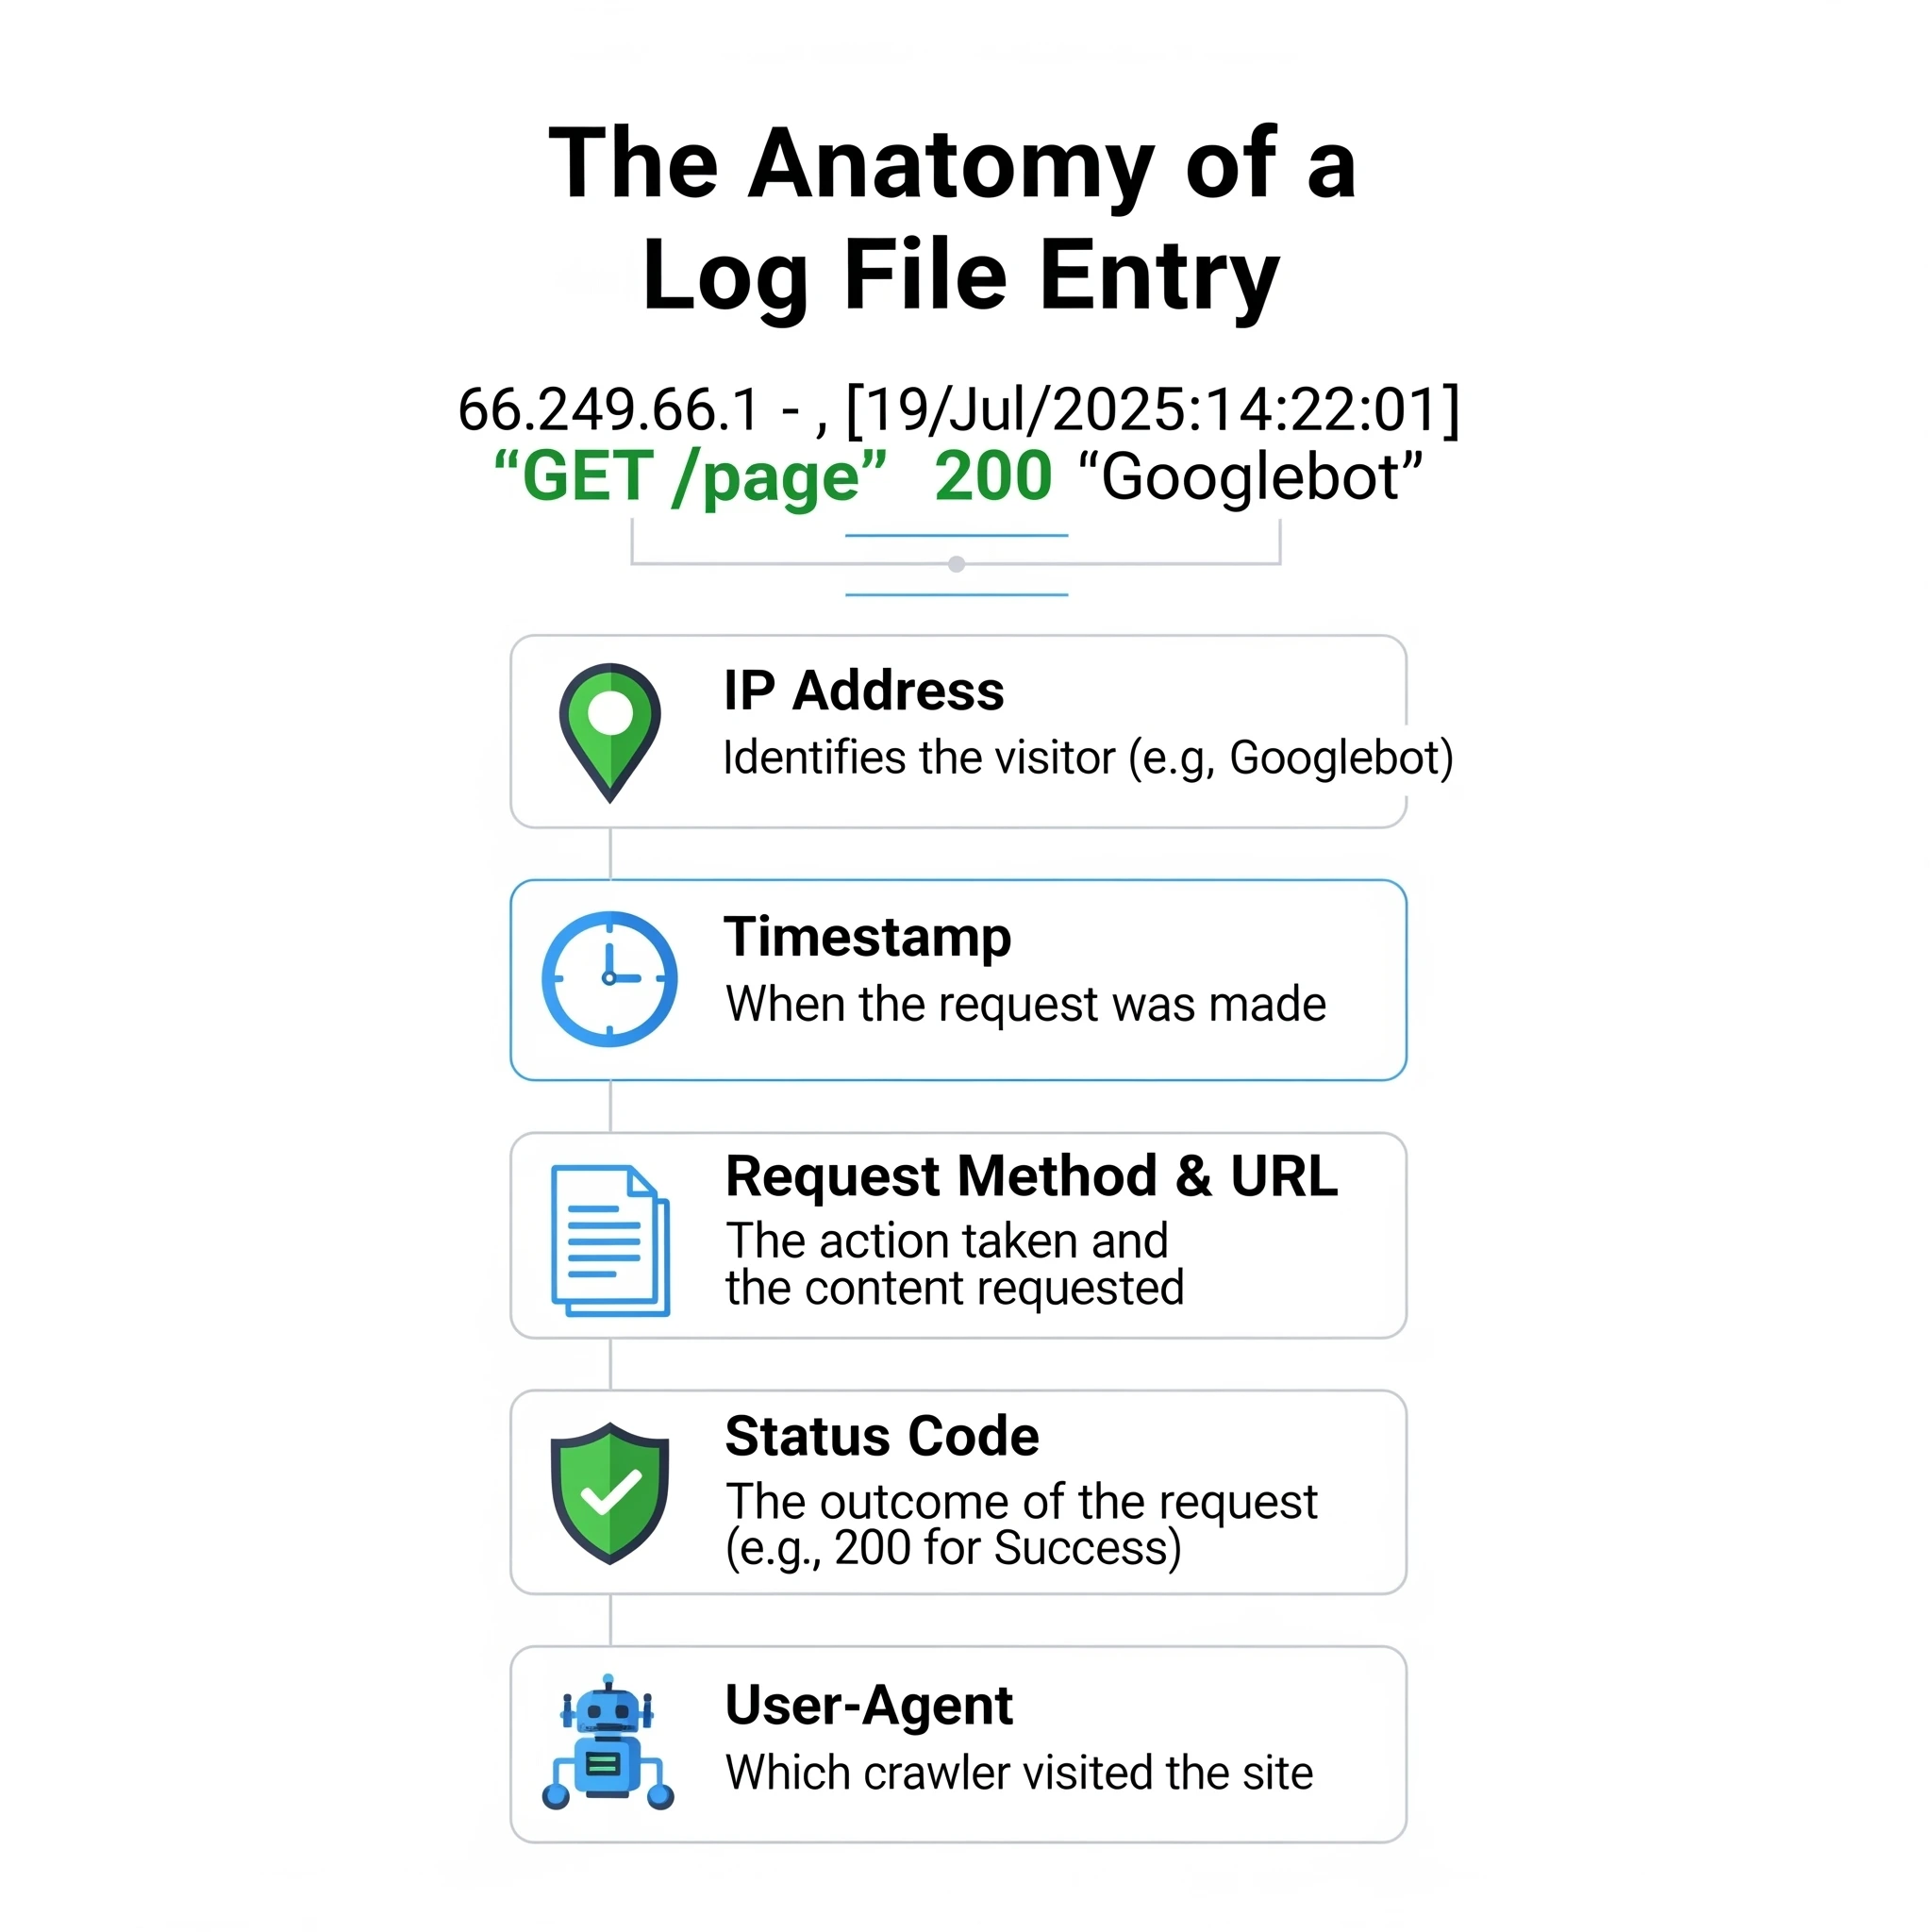
Understanding each component is vital for filtering data correctly:
| Component | Example | Description |
|---|---|---|
| IP Address | 66.249.66.1 | The digital address of the visitor. For SEO, you verify this against known Googlebot IP ranges to ensure it's not a spoofed bot. |
| Identity | - | Usually empty (hyphen). Historically used for the remote logname of the user. |
| User ID | - | Usually empty. Used if the user is authenticated via HTTP authentication. |
| Timestamp | [19/Jul/2026:14:22:01 +0000] | The precise second the request occurred. This is crucial for correlating crawl spikes with site updates. |
| Request | "GET /blog/technical-seo-guide/ HTTP/1.1" | The method (GET/POST), the specific resource requested, and the protocol. |
| Status Code | 200 | The server's response. 200 is success, but spotting 3xx, 4xx, or 5xx here is where the SEO value lies. |
| Size | 15678 | The size of the response in bytes. Sudden drops in size might indicate a page rendering partially or empty. |
| Referrer | "-" | The URL that sent the visitor. For bots, this is often empty, but sometimes reveals how they found a page. |
| User-Agent | "Mozilla/5.0..." | The string identifying the browser or bot. This is your primary filter to isolate "Googlebot" traffic from regular users. |
1.2. Where to Find Your Log Files
Access varies by infrastructure. If you are on shared hosting, you might not have direct access to raw logs, or they might be archived daily.
- Apache Servers: Typically located at
/var/log/apache2/access.logor/var/log/httpd/access_log. - Nginx Servers: Usually found in
/var/log/nginx/access.log. - IIS (Windows): Located at
%SystemDrive%\inetpub\logs\LogFiles. - Cloud Hosting (AWS/GCP/Azure): Logs are often sent to storage buckets (like S3) or monitoring tools (like CloudWatch).
- CDNs (Cloudflare/Akamai): If you use a CDN, your origin server logs might only show the CDN's IP addresses. You must export logs directly from your CDN provider to see the true client IPs and User-Agents.
Accessing these files usually requires FTP (File Transfer Protocol) access or command-line access via SSH. If you are unsure, ask your hosting provider or DevOps team for "raw access logs."
Chapter 2: What is Log File Analysis in SEO?
Log file analysis is the forensic science of technical SEO. While standard audits simulate a crawl (using tools like Screaming Frog), log analysis reveals the actual crawl history.
2.1. Defining Log File Analysis
This process involves parsing raw server data to answer specific questions about search engine behavior. You are not guessing if Google likes your site structure; you are observing how much time and resources Google allocates to it.
You use this data to investigate:
- Crawl Velocity: Is Google crawling your site faster or slower after your recent deployment?
- Resource Waste: Is Googlebot getting stuck in infinite calendar loops or filter combinations?
- Status Code Discrepancies: Are bots seeing 500 errors that human users (and your manual tests) miss?
2.2. Why Log File Analysis is Crucial for SEO
Many SEOs rely solely on Google Search Console (GSC). While valuable, GSC data is sampled, delayed, and simplified. It often groups URLs or hides the granular details needed to diagnose complex issues.
Log files offer distinct advantages:
- Precise Crawl Budget Management: Crawl budget—the number of requests Googlebot makes to your site—is finite. Logs show you exactly where that budget goes. If 40% of Google's hits are on low-value tag pages, you have a clear optimization target.
- Real-Time Error Detection: GSC might take days to report a spike in 5xx errors. Logs show them instantly. If you launch a new feature and logs immediately show Status 500 for Googlebot, you can roll back before your rankings tank.
- Validating "Orphan" Pages: An orphan page has no internal links. Standard crawlers cannot find them. However, if Googlebot is hitting a URL that isn't in your sitemap or site structure, it exists in Google's index (likely from an old external link). Logs are the only way to find these ghost pages.
- Algorithmic Impact: Frequent crawling often correlates with importance. If your "money pages" are only crawled once a month, Google likely views them as low priority.
For a deeper dive into how this data fits into broader analytics, read our guide on SEO analytics and insights.
Chapter 3: How to Perform a Log File Analysis
The analysis process transforms messy text files into clear charts and action items.
3.1. The Step-by-Step Process
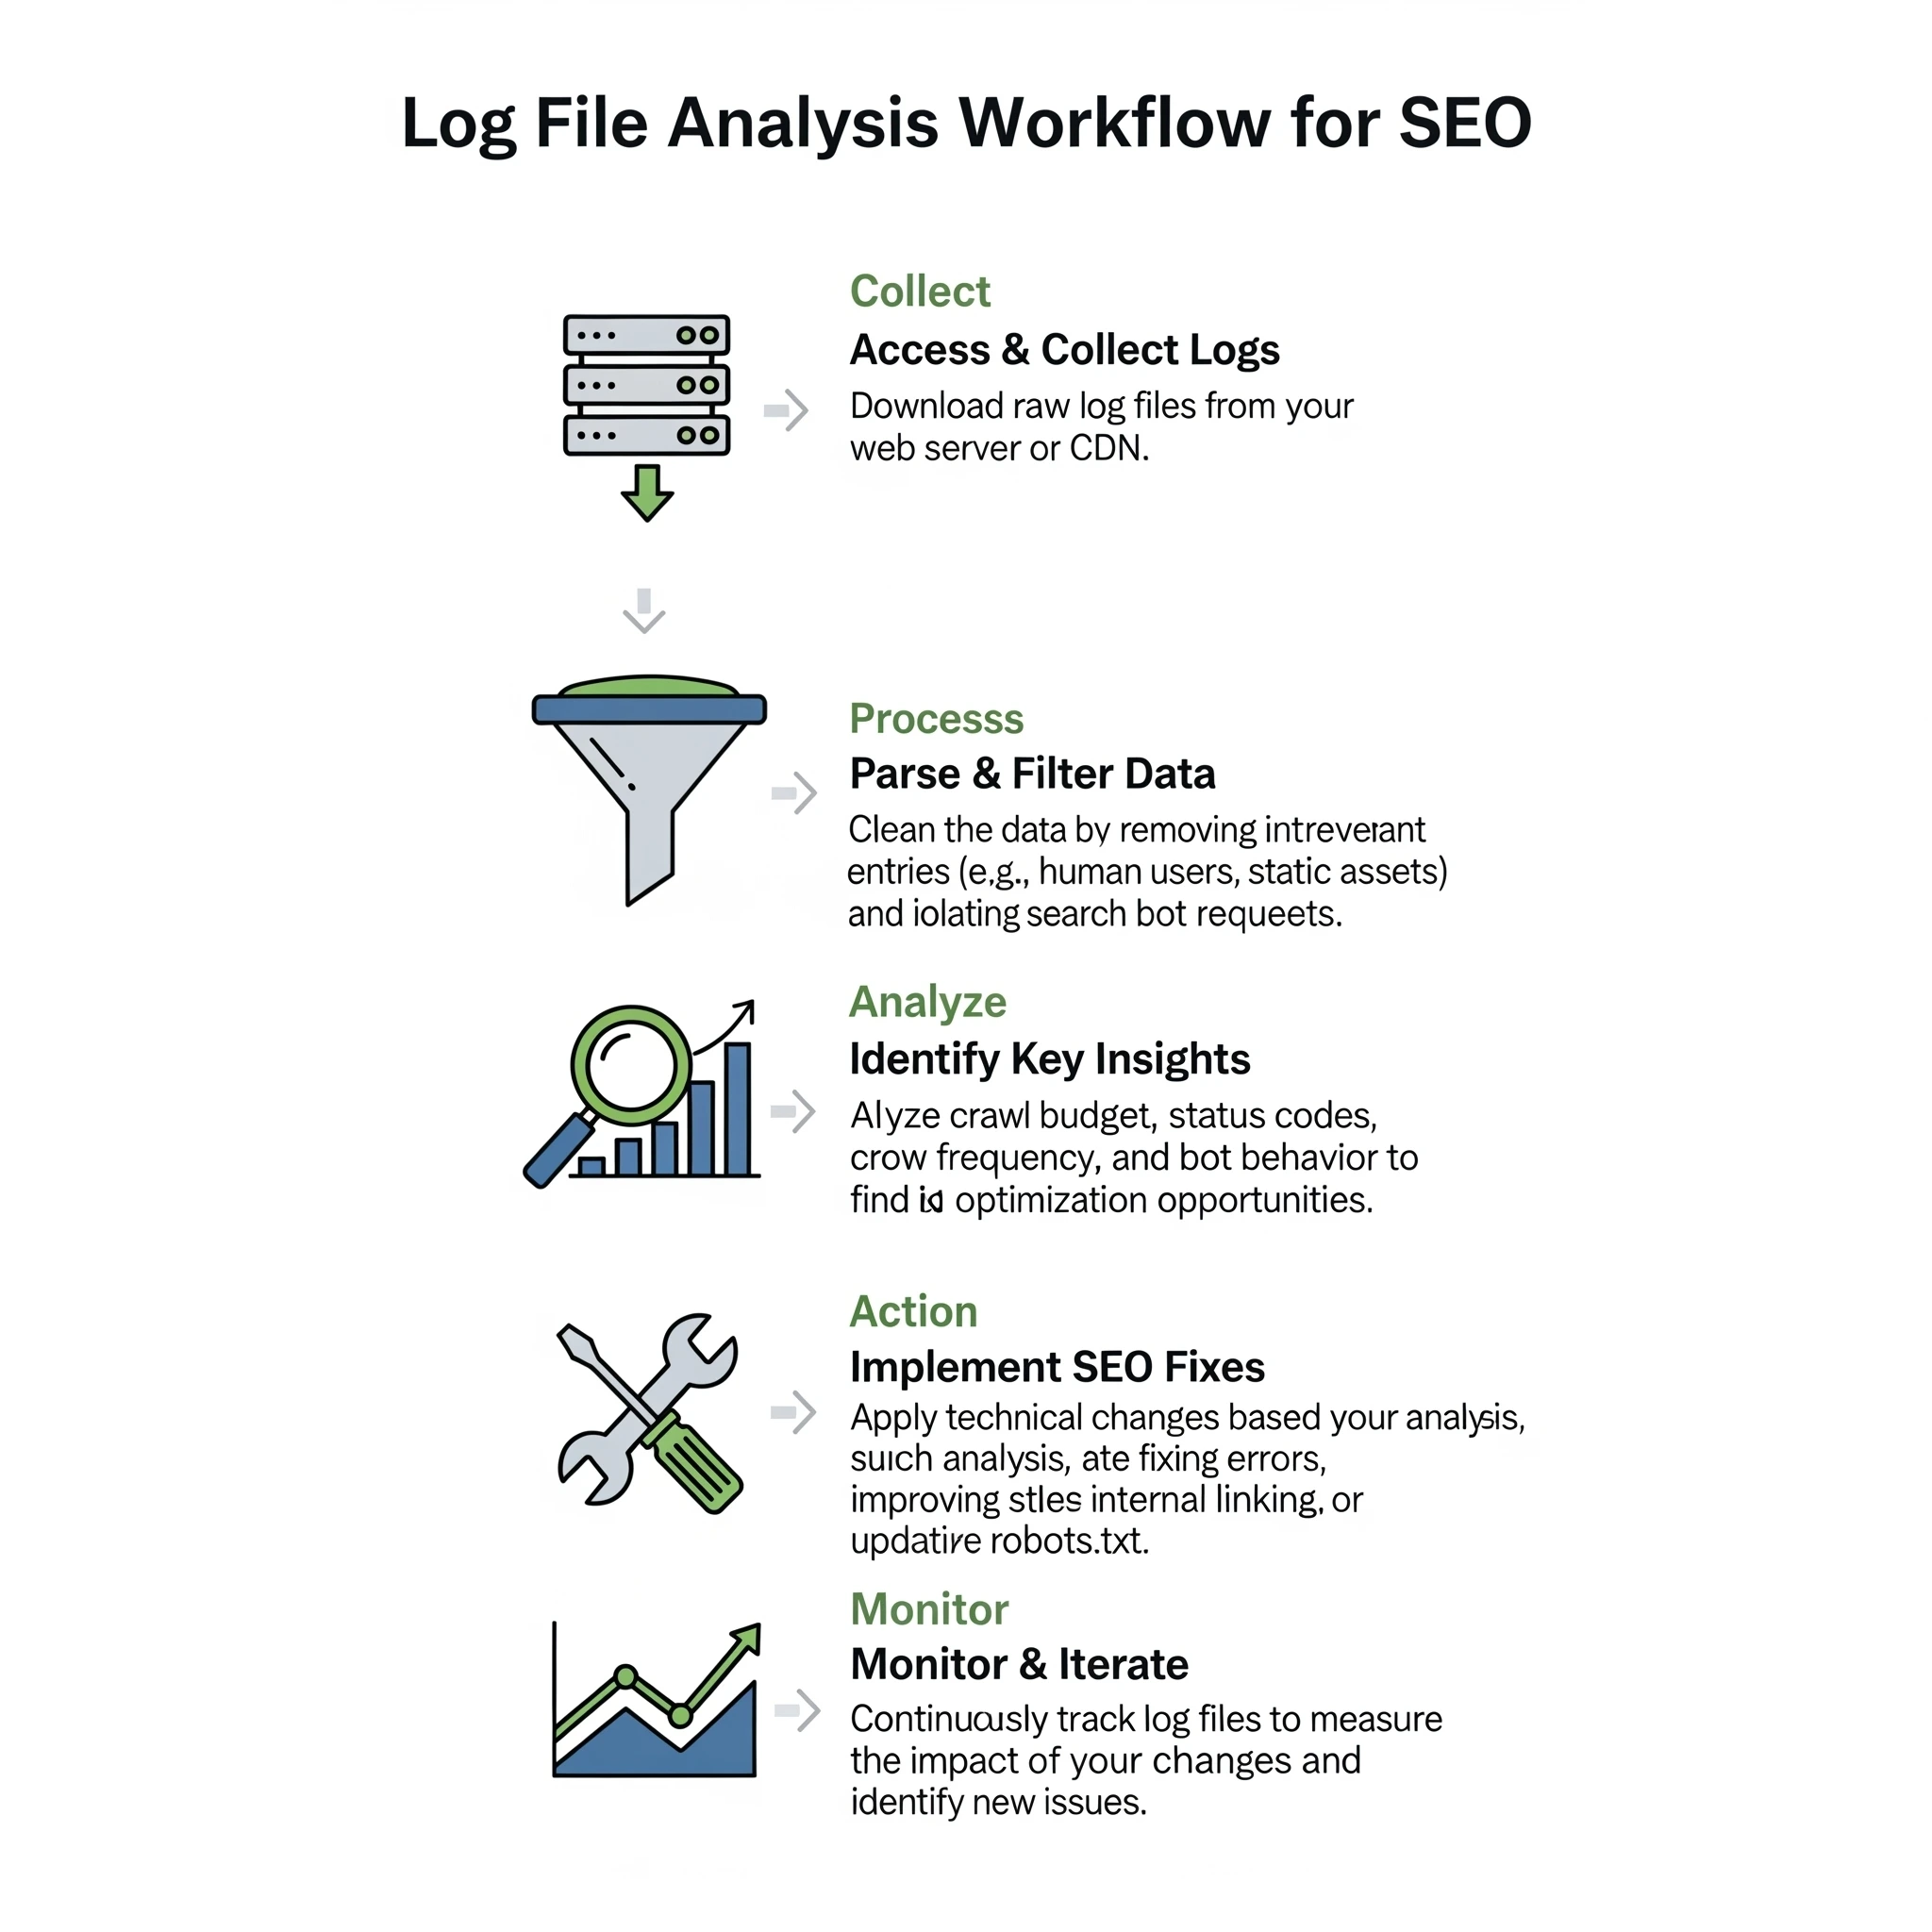
- Collection: Download logs for a meaningful period. A minimum of 30 days is recommended to see patterns, though 2-3 months is better for identifying trends.
- Verification: This is a critical security step. Anyone can spoof a User-Agent string to look like "Googlebot." To ensure you are analyzing real Google traffic, you must verify the IP addresses against Google's published list of IPs (or use a tool that does reverse DNS lookups automatically).
- Parsing: Raw logs are just text lines. You need to parse them to separate the fields (Time, IP, URL, Status Code, User Agent) into columns.
- Filtering: Filter the dataset to include only verified search engine bots (Googlebot Smartphone, Googlebot Desktop, Bingbot, etc.). Remove all human traffic and generic bots.
- Pivot & Analyze: Aggregate the data by directory, status code, or specific URL patterns to find anomalies.
3.2. Tools for Log File Analysis
Your choice of tool depends on your technical comfort level and the size of your data.
- Excel / Google Sheets: Feasible for small sites with less than 50,000 log lines. You can use text-to-columns to parse the data. However, files larger than 100MB will crash most spreadsheet software.
- Command Line (Grepping): For quick checks, Linux commands like
grepandawkare powerful. You can instantly count how many times Googlebot hit a specific URL pattern directly on the server. - Screaming Frog Log File Analyser: A dedicated desktop tool that simplifies parsing. You drag and drop files, and it visualizes the data.
- ELK Stack / BigQuery: For enterprise sites with millions of hits daily, you need database solutions. The ELK stack (Elasticsearch, Logstash, Kibana) allows you to visualize massive datasets in real-time.
- Digispot AI: Manual parsing is slow and error-prone. Digispot AI integrates log analysis with crawl data automatically. It cross-references what Googlebot sees against your actual site structure, highlighting gaps instantly without spreadsheet headaches.
Chapter 4: Key SEO Insights from Log File Analysis
Once you have clean data, what should you look for? Here are the specific insights that drive higher rankings.
4.1. Crawl Budget Optimization
Crawl budget is not just for sites with millions of pages. Even smaller sites can suffer if bots get trapped. Efficient crawling ensures new content is indexed faster and updates to existing content are reflected in search results sooner.
Identifying Waste: Sort your crawled URLs by frequency. You might discover that Googlebot spends 20% of its time crawling:
?sort=price_ascand?sort=price_descparameters.- Session ID URLs.
- Infinite calendar pages (e.g.,
/events/2035/).
Solution:
If you find these patterns, you have actionable data. You can block these parameters in robots.txt or use the Parameter Handling tool in GSC. By restricting access to low-value URLs, you force Googlebot to focus on your high-value articles and product pages.
4.2. Identifying and Fixing Crawl Errors
A standard crawler checks your site now. Logs tell you what happened when you weren't looking.
Status Code Analysis:
- 302 vs. 301: Logs often reveal developers using 302 (temporary) redirects for site migrations instead of 301s. This tells Google "come back later" rather than "pass the authority here." Fixing this preserves link equity.
- Soft 404s: Sometimes a server returns a "200 OK" code for a page that is actually broken or empty. If you see Googlebot hitting a page thousands of times but it never ranks, check if it's a "soft 404" wasting resources.
- Sporadic 500 Errors: These are the most dangerous. If your server times out only during high-traffic hours, a manual audit at midnight won't catch it. Logs will show clusters of 500/503 errors during peak times, indicating a hosting capacity issue.
Learn more about diagnosing these technical pitfalls in our guide to common SEO mistakes.
4.3. Discovering Orphan Pages
One of the most valuable insights from log analysis is finding pages Google knows about that you have forgotten.
The Comparison: Combine a crawl of your website (using a tool like the Digispot On-Page SEO Analysis) with your log data.
- List A: URLs found by crawling your navigation links.
- List B: URLs found in your server logs.
Any URL in List B that is NOT in List A is an orphan page. Google is visiting it, but users cannot click to it.
Action Plan:
- Valuable Content? Add internal links immediately.
- Old/Outdated? Redirect (301) to a relevant current page.
- Spam/Hack? Sometimes logs reveal weird URLs created by a security breach. If you see URLs you didn't create, investigate immediately.
4.4. Analyzing Search Bot Behavior
Not all bots are equal. You can segment traffic to see:
- Mobile vs. Desktop: Google has switched to Mobile-First Indexing. Your logs should show the vast majority of requests coming from
Googlebot Smartphone. IfGooglebot Desktopis still primary, you may have a configuration issue preventing mobile switchover. - Freshness: How fast does Google crawl new content? If you publish a post at 9:00 AM and logs show the first hit at 9:05 AM, your site has high authority. If it takes 3 days, you need to work on building authority and internal linking.
4.5. Improving Site Migrations
Migrations are risky. Traffic drops often happen because redirects fail or old URLs are left behind.
During a migration, monitor logs daily. You want to see:
- Googlebot hitting the old URLs.
- The server returning a 301 status.
- Googlebot subsequently hitting the new URLs with a 200 status.
If you see Googlebot hitting old URLs and getting a 404, you missed redirects. If the activity on new URLs doesn't pick up, Google is struggling to discover the new structure.
Chapter 5: Advanced Log File Analysis Techniques
For power users, log analysis goes beyond basic error checking.
5.1. Correlating Log File Data with Other Data Sources
Context is king. To get the full picture, blend log data with other metrics.
Crawl Frequency vs. Organic Traffic: Does being crawled more often lead to more traffic? Usually, yes. Plot the number of Googlebot hits per page against organic visits. You will often see a strong positive correlation. This data proves to stakeholders that technical SEO investments (like improving server speed to allow more crawling) directly impact revenue.
Crawl Ratio: Calculate your Crawl Ratio: (Pages Crawled / Total Indexable Pages) * 100. If you have 10,000 pages but Google only crawls 2,000 unique URLs a month (20% ratio), you have a severe discoverability problem. You likely need to prune low-quality content or improve your Core Web Vitals to encourage deeper crawling.
5.2. Real-Time Log File Monitoring
For e-commerce sites or news publishers, waiting for a monthly audit is too slow. Real-time log monitoring involves streaming log data into a dashboard.
This setup acts as an early warning system.
- Scenario: You push a code update that accidentally adds a
noindextag to product pages. - Result: Googlebot activity drops to zero or shifts patterns instantly.
- Alert: A real-time monitor triggers an alert, allowing you to revert the code before pages are de-indexed.
Digispot AI provides this level of vigilance, alerting you to crawl anomalies as they happen so you never lose sleep over a bad deployment.
Chapter 6: Common Misconceptions about Log File Analysis
Let's clear up some myths that prevent SEOs from using this powerful data.
6.1. "Log file analysis is only for large websites."
False. While enterprise sites produce more data, small sites often suffer from "crawl neglect." If you have a 500-page site but Google only visits 10 pages a week, you have a problem that only logs will reveal. Small sites are also more vulnerable to negative SEO attacks (bots spamming your server), which logs can identify instantly.
6.2. "Google Search Console's Crawl Stats report is enough."
The Crawl Stats report is a helpful summary, but it lacks granularity. It tells you "average response time" but not which specific pages are slow. It tells you "server errors" occurred but not exactly when or where. GSC is the dashboard; log files are the engine diagnostics. You need the latter to fix the former.
6.3. "Log file analysis is a one-time task."
The web is dynamic. Google updates its bot behavior, and your site code changes constantly. Log analysis should be part of your routine—monthly for general health, and daily/weekly during major changes. Regular audits help you maintain a clean, efficient ecosystem for search bots. For a complete routine, refer to our 2026 SEO Audit Checklist.
Start Improving Your Technical SEO Today
Log file analysis bridges the gap between what you think is happening on your website and what is actually happening. It removes the blinders, giving you direct insight into Google's behavior.
By identifying wasted crawl budget, fixing invisible errors, and optimizing your site architecture based on real bot data, you give your content the best possible chance to rank. Technical SEO is the foundation of organic growth, and logs are the blueprint.
Ready to see your site through Google's eyes? Manual analysis is powerful, but automating it ensures you never miss a beat. Use the Digispot AI platform to integrate log insights with comprehensive site audits, schema validation, and real-time monitoring. Don't let technical errors hold your rankings back—start auditing smarter today.
References
- Google Search Central: Introduction to Crawling and Indexing
- Google Search Central: Crawl Budget Management for Large Sites
- HTTP Status Codes - Mozilla Developer Network
- Robots.txt Specifications - Google Search Central
- DigiSpot AI - FREE On-Page SEO Audit Tool
- DigiSpot AI - FREE Schema Markup Visualizer
- DigiSpot AI - FREE Schema Markup Generator
Audit any page in seconds
200+ SEO checks including Core Web Vitals, schema markup, meta tags, and AI readiness — trusted by 1000+ SEO experts and marketers.
Frequently Asked Questions
Here are some of our most commonly asked questions. If you need more help, feel free to reach out to us.

Written by
Maya Krishnan
Digital growth expert
Maya is a seasoned expert in web development, SEO, and digital strategy, dedicated to helping businesses achieve sustainable growth online. With a blend of technical expertise and strategic insight, she specializes in creating optimized web solutions, enhancing user experiences, and driving data-driven results. A trusted voice in the industry, Maya simplifies complex digital concepts through her writing, empowering readers with actionable strategies to thrive in the ever-evolving digital landscape.